A RF attenuator is a device that reduces the power of the signal that passes through it. It is connected in series with the signal source and load. A passive attenuator is a completely passive resistive network with no power source. This device may be utilized in a number of RF circuits for a variety of applications. It is commonly used to attenuate high-power signals for test equipment, provide impedance matching, and balance signal levels. In this blog, I will show you how to design, build, and test a passive RF attenuator.
Pi attenuator
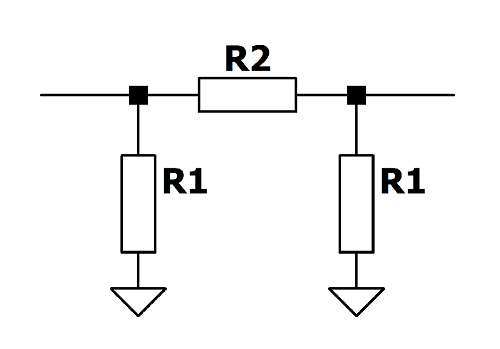
The Pi attenuator circuit can be balanced or unbalanced. In an unbalanced circuit, as shown in Figure 1, the impedance of two transmission lines is not equal with respect to the ground. This type of circuit is suitable to connect with an unbalanced transmission line, such as a coaxial cable. The circuit in Figure 1 resembles the Greek letter π, thus the name Pi attenuator.
When the values of both shunt resistors are identical, a Pi attenuator operates as a symmetrical attenuator. The characteristic impedance of the symmetrical attenuator is the same on both the input and output sides. This means that input and output terminals can be swapped with each other. When you need to lower the power of a signal in a system with equal source and load impedance, a symmetrical Pi attenuator is a good choice.
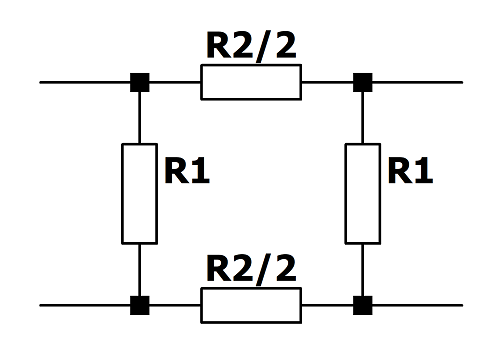
In a balanced Pi attenuator circuit, half the series resistance is placed on both the top and bottom lines, as shown in Figure 2. This circuit has two transmission lines with equal impedances with respect to ground. The balanced attenuator is suitable for a balanced transmission line, such as a twisted-pair cable.
Pi attenuator equations
If we know the required attenuation in decibels (dB) and the source/load impedance in ohms, we can calculate the values for R1 and R2 as follows:
$$R_{1}(\Omega )= Z_{0}(\Omega )\cdot \left [\frac{10^{\frac{dB}{20}}+1}{10^{\frac{dB}{20}}-1}\right]$$
$$R_{2}(\Omega )= \frac{Z_{0}(\Omega )}{2}\cdot \left [\frac{10^{\frac{dB}{10}}-1}{10^{\frac{dB}{20}}}\right]$$
Design of a Pi attenuator
In this case, we have matching source and load impedances that are equal to 50 ohms. And we need to attenuate a signal by 20 dB.
Using the previous formulas, we can calculate R1 and R2:
$$R_{1}(\Omega )= 50\Omega\cdot \left [\frac{10^{\frac{20}{20}}+1}{10^{\frac{20}{20}}-1}\right]= 61.1 \Omega$$
$$R_{2}(\Omega )= \frac{50\Omega}{2}\cdot \left [\frac{10^{\frac{20}{10}}-1}{10^{\frac{20}{20}}}\right]= 247.5\Omega$$
Pi attenuator construction
In the previous section, calculated values for R1 and R2 are not that easily available, or at least I don’t have them laying around. Therefore, we’ll have to use our imagination to come up with similar values by connecting resistors in parallel. We can get 61.2 ohms by connecting 110 and 138 ohm resistors, which is good enough for me. For R2, I have 470 and 510 ohm resistors lying around, and in parallel, they make 244.6 ohms. This value will work for me too.
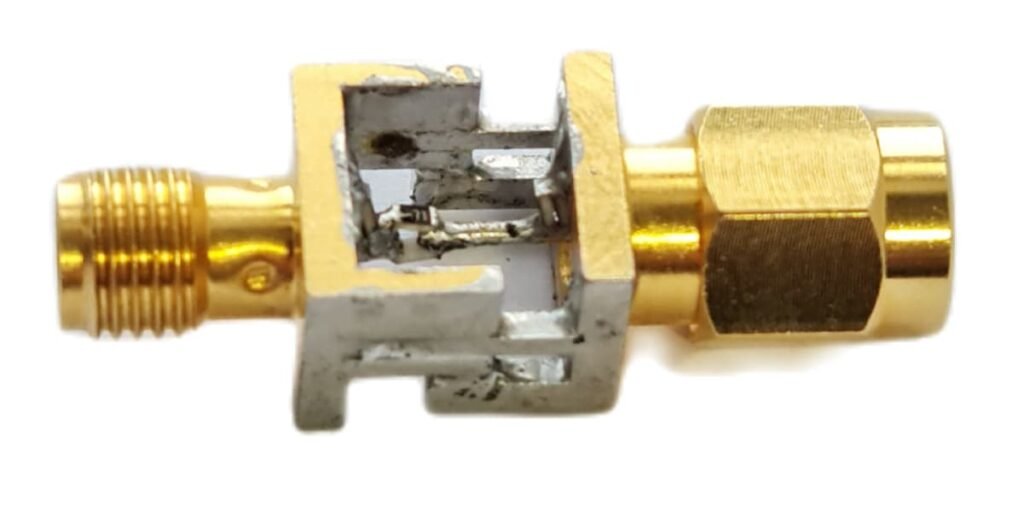
I am a bit lazy, so I will not design a PCB for this attenuator. I’ll need to solder R2 to each of the SMA connector’s center pins, then wire R1 resistors from each center pin to the connector’s body. That’s why I chose a PI attenuator, which has only one series resistor and is mechanically more stable for this type of design. The structure shown in Figure 3 was created when all of the connections were completed.
Pi attenuator testing
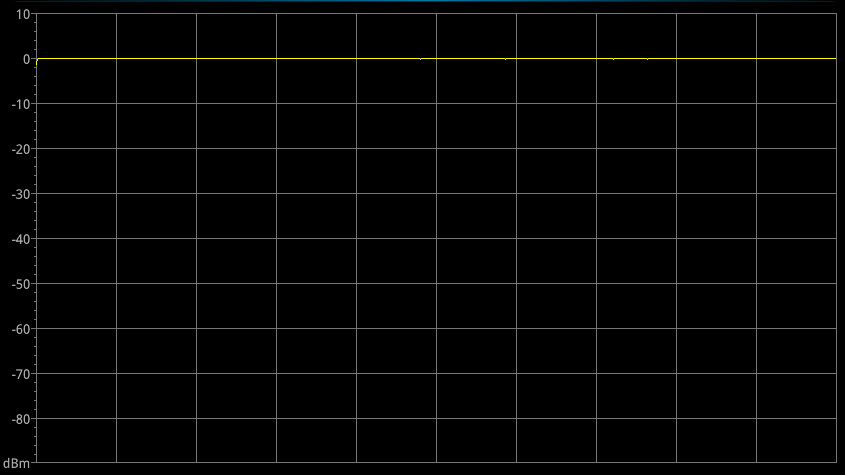
A spectrum analyzer with a tracking generator will be required to test the attenuator. First of all, we need to connect the tracking generator output to the spectrum analyzer’s RF input. Then we need to turn on the tracking generator. After that, we want to get rid of all of the errors that are caused by the cables, adapters, and connectors that are in the test circuit. We can do so through the normalization process. When we “normalize”, we should get a flat line that is at 0 dB, like in Figure 4. I should note that when we activate normalization, we are subtracting the measured curve from itself which results in a flat line at 0 dB.
Remember to tighten SMA connectors by turning the nut rather than spinning the female end in. If you do the opposite, the middle pin of the connector will wear out quickly.
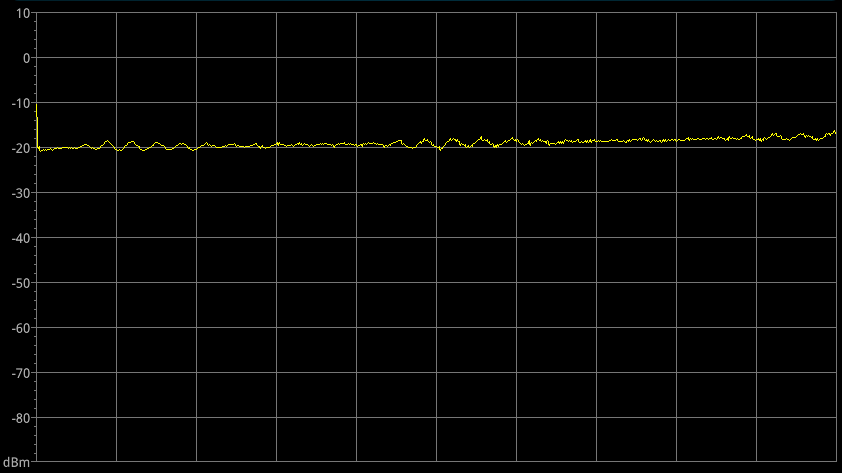
Now we can connect our attenuator to the spectrum analyzer, and we should get something like in Figure 5. We had a flat line at 0 dB, and now it is at -20dB. This indicates that the attenuator is functioning properly and that our signal has been attenuated by 20 dB, as desired.
Summary
An attenuator is a device used to reduce the power of the source without distorting its signal waveform. One of the most basic attenuator configurations is the Pi attenuator. Its design may seem challenging, but it can be accomplished by following several simple steps. First of all, you need to determine what kind of attenuation you need and then figure out your system impedance. Once you do that, resistance values for the attenuator can be calculated using the formulas provided above.