For many motorcycle riders, the instrument cluster is the heart of their machine. It’s where they can easily check their speed, fuel level, and other vital information while on the road. My motorcycle instrument cluster stopped working a while back, and I had to replace it with a cheap Chinese one. Needless to say, it wasn’t all that good. Also, it missed many functions that I would have liked to have.
The initial plan was to build my own digital instrument cluster with an LCD screen. I intended to add a slew of useful functionality that the original instrument cluster lacked. I had been putting off this job for a long time. But I’ve finally decided to do it.
This project is likely to take a long time to be completed. Hence, this will be a series of posts that will document my progress. In these posts, I’ll share the story of my motorcycle instrument cluster project, detailing the challenges, triumphs, and lessons learned along the way. Whether you’re a motorcycle enthusiast or simply interested in DIY electronics projects, I hope my journey inspires you to explore your own creative ideas and possibilities.
The scope of the project
Starting an electronics project is always difficult, especially when requirements are not clearly defined. And even when they are, there are usually a lot of changes along the way. Before I begin, I need to clearly outline my goals for my digital instrument cluster project. This includes choosing the type of information I want to display, the size and structure of the instrument cluster, and any other features that I believe might be useful.
The instrument cluster will be for the Kawasaki Z1000 that was made in 2006. The Kawasaki Z1000 is a four-cylinder motorcycle introduced in 2003. It has a 953 cc four-stroke, four-cylinder, liquid-cooled, fuel-injected engine that delivers an output power of 127 hp and 96 Nm of torque. It’s quite impressive even today, but this project is about its instrument cluster. Therefore, we’ll start by looking at the capabilities of the original Kawasaki Z1000 instrument cluster (shown in Figure 1).
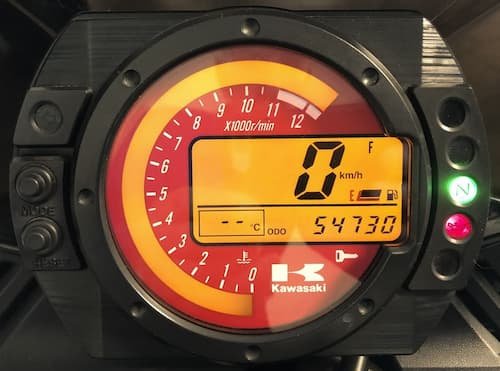
Kawasaki Z1000 instrument cluster analysis
In this section, we will go through a Kawasaki Z1000 service manual and analyze every signal that comes into the instrument cluster. Before we begin adding new features, we must ensure that we have reproduced every function of the original instrument cluster. And then after, we’ll add some new and modern features that even the new motorcycles don’t have.
The connector pinout for the instrument cluster, also known as the “Meter Unit”, may be found in the Kawasaki Z1000 service manual (Figure 2). This information is highly valuable as it contains information on all signals that come to the instrument cluster.
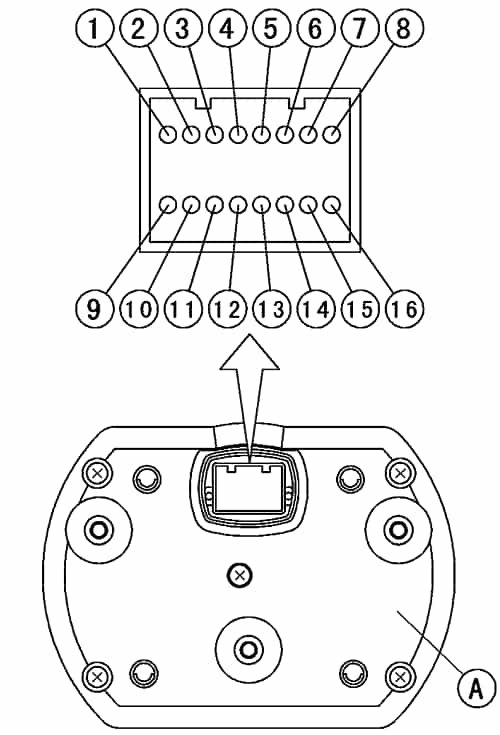
Here:
- Ignition
- Fuel Reserve Switch
- Unused
- Fuel Level Sensor
- Neutral Indicator Light (LED) Ground (–)
- FI Indicator Light (LED) Ground (–)
- Tachometer Pulse
- Water Temperature Sensor
- Ground (–)
- Battery (+)
- Oil Pressure Warning Indicator Light (LED) Ground (–)
- Speed Sensor Supply Voltage
- Right Turn Signal Light (LED) (+)
- Left Turn Signal Indicator Light (LED) (+)
- High Beam Indicator Light (LED)
- Speed Sensor Pulse
We now know what kinds of signals come to the instrument cluster, but we still need to figure out all of their electrical properties. Therefore, we’ll go over each one separately.
[1] Ignition
There isn’t much information available regarding this pin, but I’m guessing that when the ignition is turned on, the signal from this pin enables power supply to the device.
[2] Fuel Reserve Switch
This one is a bit tricky. According to the “Fuel Level Gauge Examination” section, the reserved fuel segment should flash when the voltage on the [2] terminal is less than 5.7V. Therefore, it may appear that we need to monitor the voltage at this pin. However, in the “Fuel Reserve Switch Inspection” section, a testing technique with a full and empty fuel tank is described. When the fuel tank is full, the sensor should act as an open switch. And when the tank is empty, it should operate as a closed switch to ground. So we just need to keep an eye on whether or not this pin is shorted to ground.
[3] Unused
Well, it is unused.
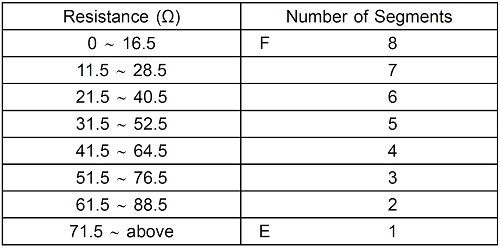
[4] Fuel Level Sensor
The fuel level is displayed on the instrument cluster via 8 segments. Each segment represents the amount of fuel remaining in the tank. According to the “Fuel Level Sensor Examination” section, the sensor should be at 4∼10 Ω while in full position and 90∼100 Ω when in empty position. A table of resistance values vs. fuel level indication segments is provided in the “Fuel Level Gauge Examination” section (Figure 3).
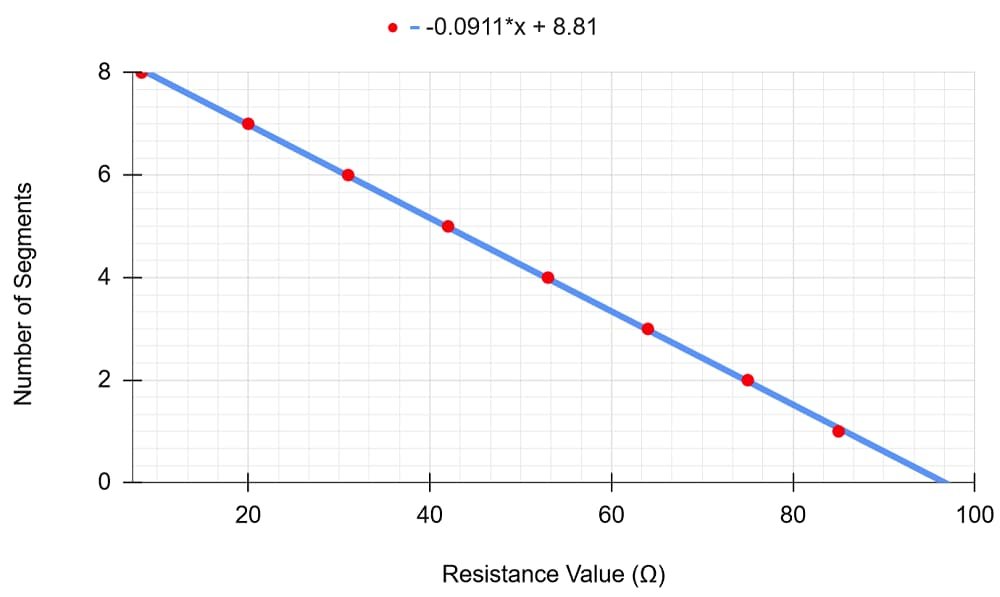
After calculating the average resistance, we can plot the points from the table on a graph (Figure 4). We can observe from the dots on the graph that the points are distributed linearly. Therefore, we can apply the linear equation.
$$FUEL_{LEVEL}= -0.0911\cdot R+8.81$$
[5] Neutral Indicator Light (LED) Ground (–)
The “Neutral switch” is shorted to ground when the transmission is in neutral. This means that when the wire is shorted to ground, we should indicate that the transmission is in neutral.
[6] FI Indicator Light (LED) Ground (–)
When a fault in the system occurs, the FI indicator LED light illuminates to inform the rider. Furthermore, the problem’s state is saved in the ECU’s memory. The FI indicator provides information about DFI and the ignition system. When the signal is shorted to ground, we should illuminate the FI indication.
[7] Tachometer Pulse
There will be a problem with this one. In the “Tachometer Check” section, there is information on only one point. When a 12V, 200 Hz, 50% duty cycle signal is applied to the meter unit’s [7] input, the tachometer should read 6000 rpm. This seems odd, as I would expect the signal frequency to be the same as the engine speed multiplied by the number of teeth on the timing rotor. Perhaps Kawasaki is using an RC circuit to convert the signal to a DC level before measuring voltage with an ADC.
We also know from the service manual that the idle engine should run at 1100 50 r/min (rpm).
So none of this information provides us with precise details on how to assess engine speed. I will have to measure this signal myself. Also, it will be necessary to look into what the Kawasaki Z1000 timing rotor looks like. After seeing the signal and comparing it with the number of timing rotor teeth, I will be able to conclude whether the odometer is receiving a raw or processed signal.
[8] Water Temperature Sensor
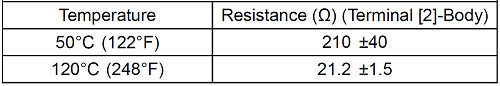
A table of resistance vs. temperature indication readings is provided in the “Water Temperature Meter Check” section (Figure 5).
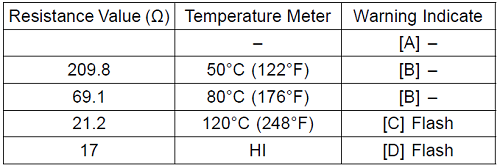
Additional information regarding water temperature sensors can be found in the “Water Temperature Sensor Inspection” section. We can find that at 50 °C, resistance can vary by 40 Ω from sensor to sensor. At 120°C, the difference is merely 1.5 Ω (Figure 6).
We can plot numbers from the table in Figure 5 on the graph (Figure 7). From this graph, we can see that the dots are not distributed linearly. Thus, we’ll have to do a curve fitting. The power series curve fits well, but computing the answer will take a significant amount of computational power. For now, I’ll just use two linear equations that connect points 1-2 and 2-3.
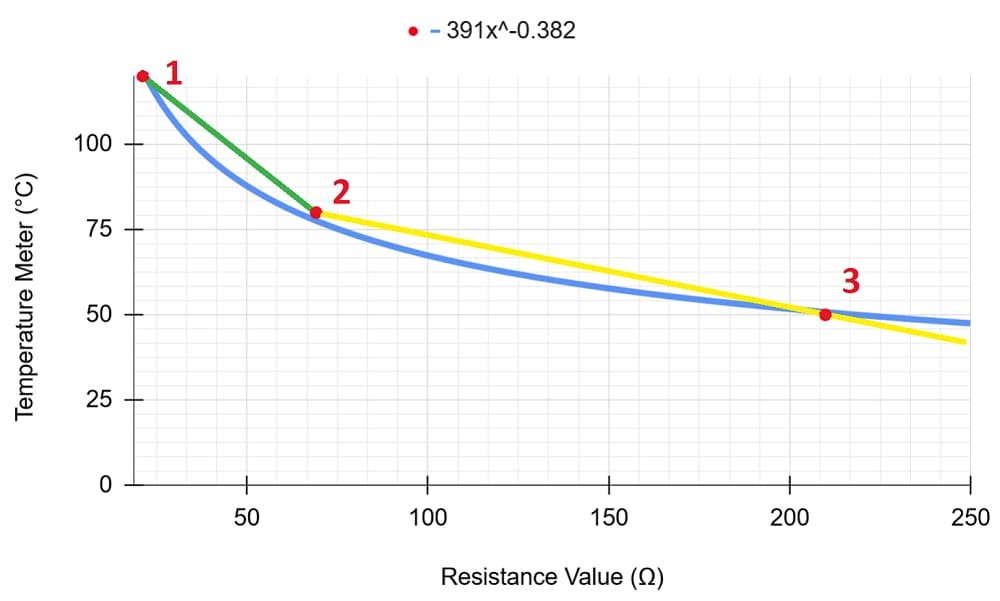
When the resistance is less than 69 Ω, the linear function is:
$$TEMP= -0.835\cdot R+138$$
When the resistance is greater than 69 Ω, the linear function is:
$$TEMP= -0.213\cdot R+94.7$$
The “Radiator Fan Switch Inspection” section states that the fan switch should turn on when subjected to a temperature of 95-101 °C. Also, it should turn off when the temperature goes below 87°C. According to motorbike forums, the radiator fan turns on when the temperature exceeds 103°C and turns off when the temperature decreases to 97°C. In the future, I will be able to measure the resistance of a temperature sensor at these temperatures and change the curve to match reality more closely.
[9] Ground (–)
This is a negative power supply terminal (ground).
[10] Battery (+)
This is a positive power supply terminal. The charging voltage of the battery ranges between 14.2 and 15.2V. We must ensure that the instrument cluster can operate at this voltage.
[11] Oil Pressure Warning Indicator Light (LED) Ground (–)
When the engine is turned off, the oil pressure switch is shorted to ground. When the engine is running, this switch is open. This indicates that the engine lubrication system is in good condition. Therefore, we will need to light the oil pressure warning indicator when the [11] pin is shorted to ground.
[12] Speed Sensor Supply Voltage
The speed sensor should be powered by 12 volts. According to the manual, if the voltage on this pin is less than 8 volts, the meter assembly should be replaced.
[13] Right Turn Signal Light (LED) (+)
The right turn indicator should light up when a 12V signal is applied to this pin.
[14] Left Turn Signal Indicator Light (LED) (+)
The left turn indicator should light up when a 12V signal is applied to this pin.
[15] High Beam Indicator Light (LED)
The beam light indicator should light up when a 12V signal is applied to this pin.
[16] Speed Sensor Pulse
This signal determines the speed displayed on the speedometer. There isn’t much information about this signal in the service manual. All that is said in the manual is:
*Indicates approximately 60 mph (or 96.56 km/h) in case the input fre-quency would be approximately 141 Hz.
*Indicates approximately 60 km/h in case the input frequency would be approximately 88 Hz.
We will assume that the value of the speed depends linearly on the frequency. Using the two points given in the manual, we can derive a linear equation:
$$SPEED= 0.653\cdot FREQ+2.548$$
The speedometer testing diagram in Figure 8 shows that testing is done using a 5V PWM signal at 50% duty cycle. However, we have to be careful with this information. The motorcycle electronics are powered by a 12 volt, so the speed sensor signal may likewise be 12 volts.
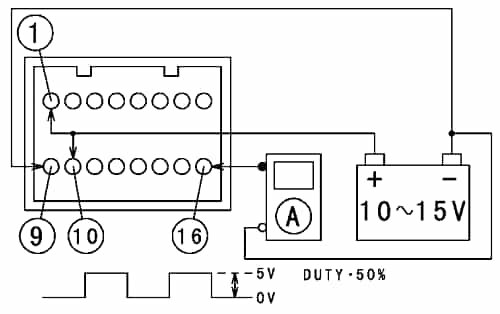
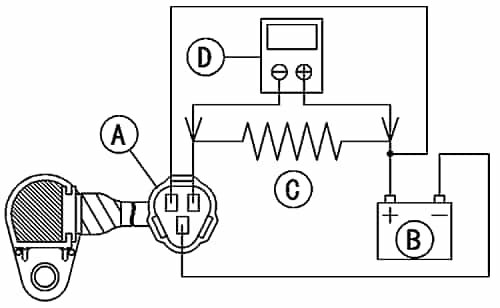
Figure 9 illustrates a test setup from the “Speed Sensor Examination” section. Here, a 10 kΩ resistor is connected between the positive terminal of the battery and the speed sensor’s output. This means that the output of the sensor is open-drain. Therefore, we will need to pull-up this pin and read how frequently it is pulled-down.
That’s all for now. In this blog post, we looked at signals going into a Kawasaki Z1000 instrument cluster. We began by determining the pinout. Next, we examined each signal in depth, detailing its properties.
In the next blog post, we’ll delve deeper into the functions of the original instrument cluster. Moreover, we will discuss further functionalities that we hope to implement. If you’re interested in learning more, be sure to check out the next part of this series.